Connect'In Tutorials - Annotations
Create a short description or engaging message to motivate your audience to take action
Creating an Annotation
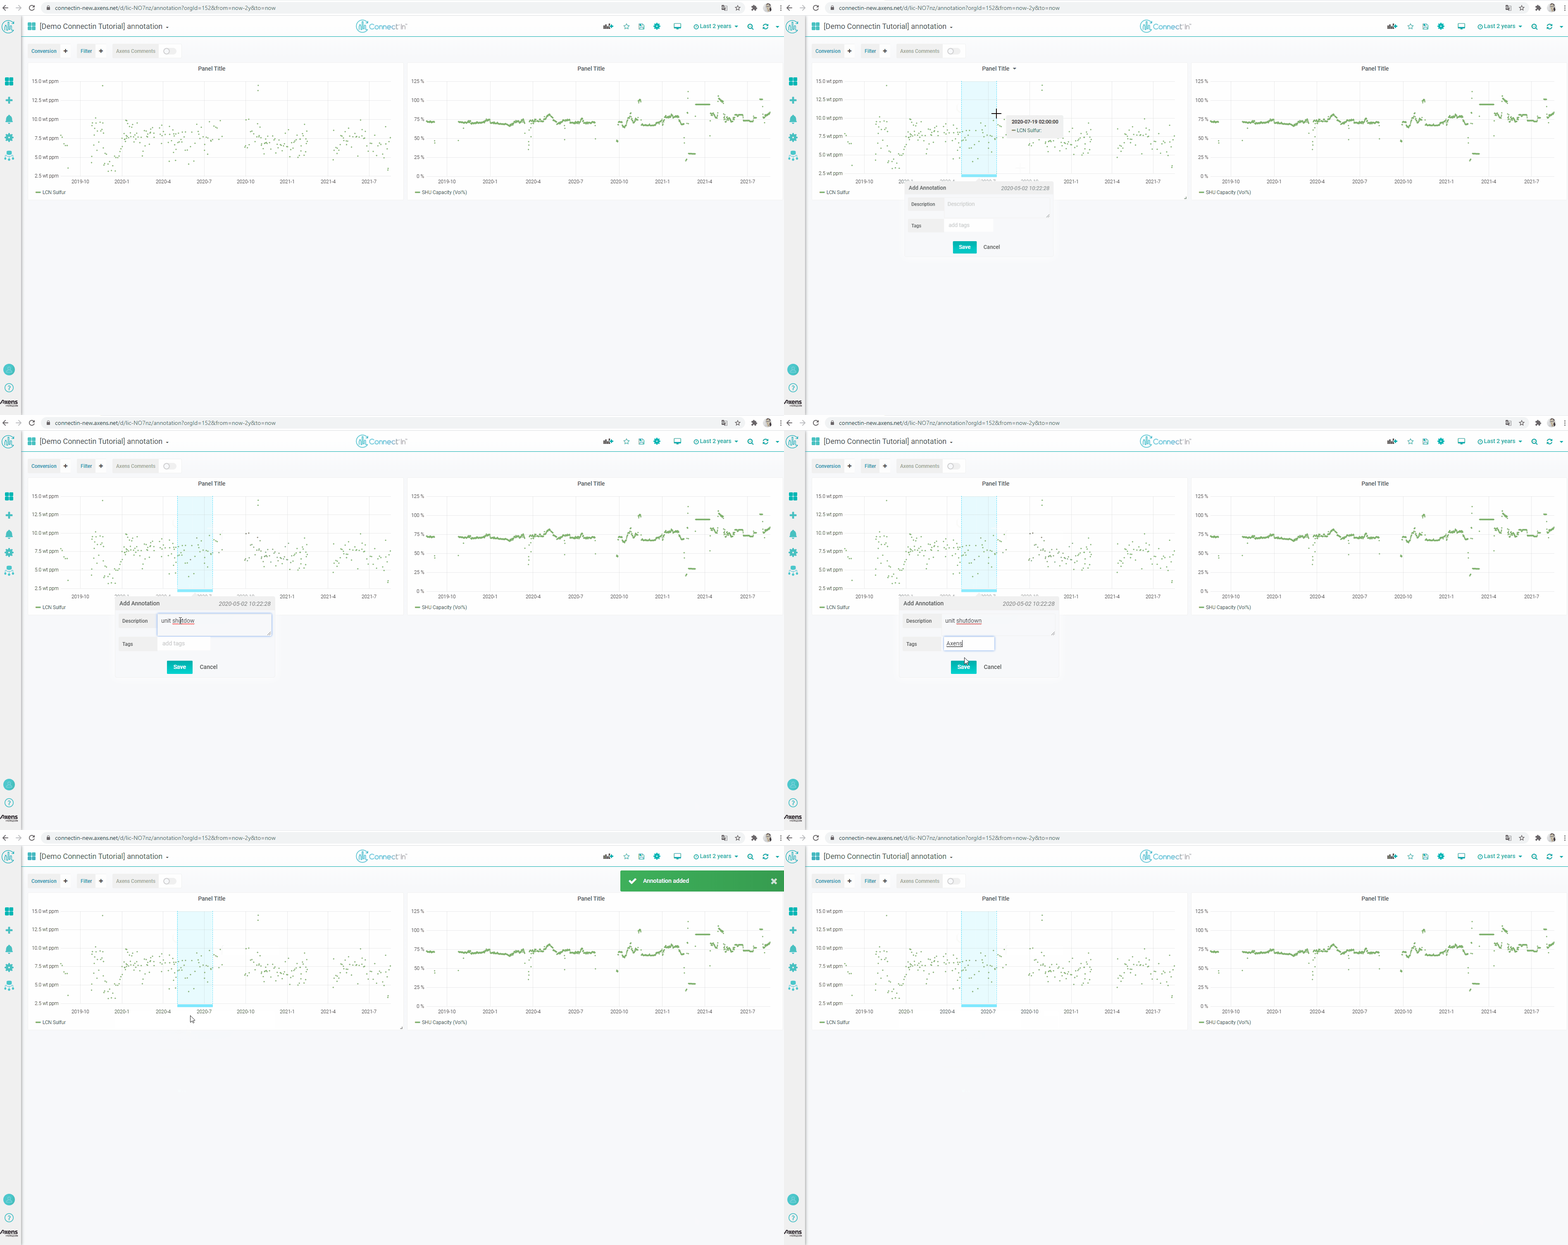
Annotations can only be added on a time-series graph. Hold down the control (CTRL) key, click and drag the time range to select a time range to be annotated.
A pop-up will be displayed. Add a Description to describe what happened during this period of time.
Tags allows users to query the annotations using tags. Multiple tags can be added for an annotation. Typically, we add "Axens" to all the annotations added by Axens. You can also add tags such as "Reactor" to an annotation to indicate that this annotation is related to reactors.
To add multiple tags, press the TAB key after the each tag is typed.


